

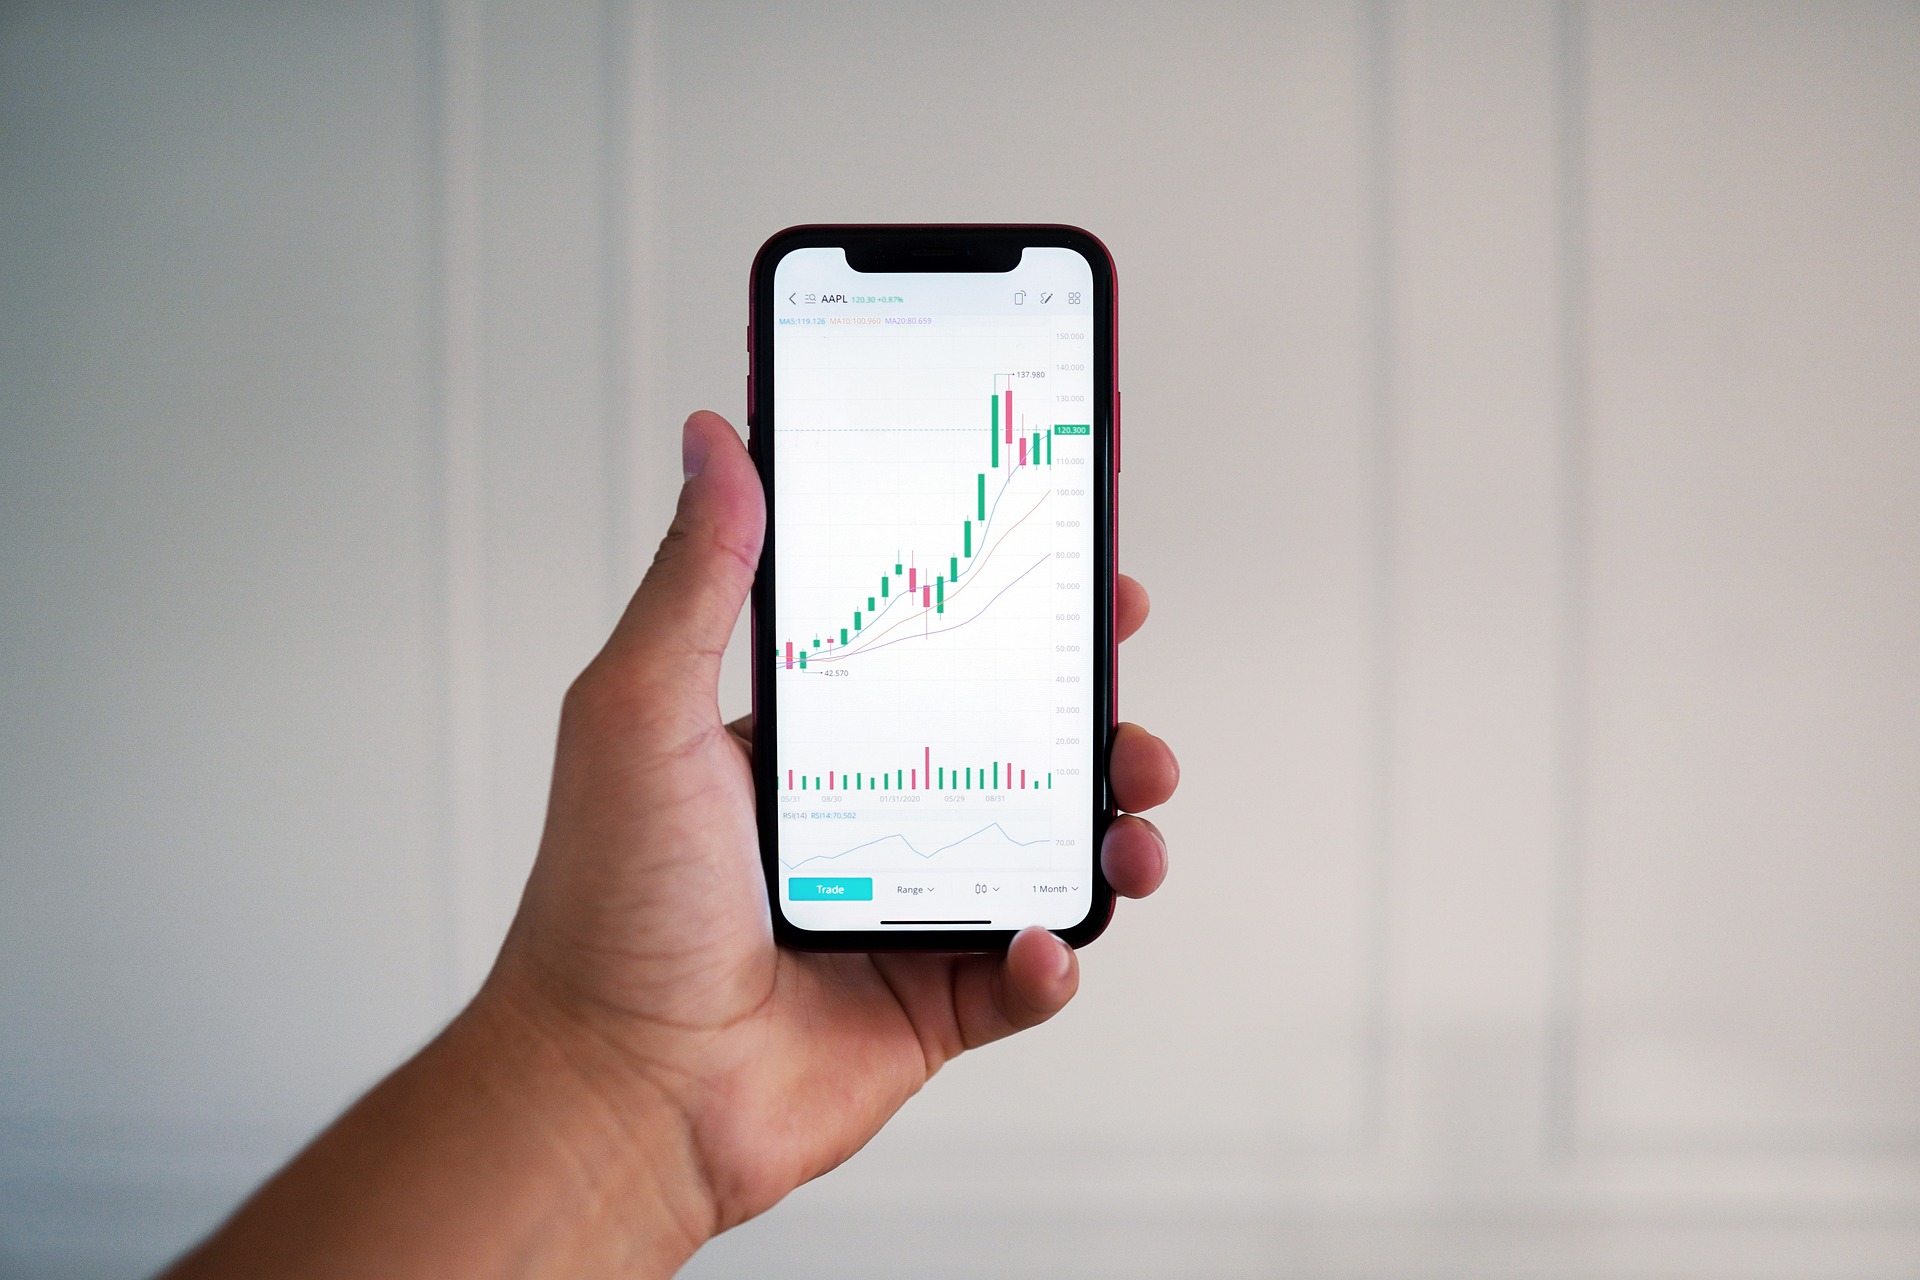
When we invest our hard-earned money in securities, it’s nice to have an insight into where the price might go. In technical analysis, we use what are known as indicators. Technical indicators examine the way prices move, and give us some insight into where they might go next. One of those indicators is the stochastic oscillator, also known as the stochastic indicator.
Understanding this dynamic trading signal can help us net big gains or avoid big losses. But to make that happen, we need to know what it is and how to use it.
What is the Stochastic Oscillator?
The Stochastic Oscillator is a type of momentum indicator based on support and resistance levels. It was developed by a man named George Lane in the 1950s. George Lane was a securities trader, author, educator, and technical analyst who taught financial professionals about technical analysis. He was a man who knew markets, and saw enough evidence of a pattern to develop this indicator.
So, what is the stochastic pattern and how does it give us trading information? To put it simply, the stochastic oscillator compares the current closing price to past prices to gauge momentum. Here’s how momentum indicators work.
Momentum Indicators
Momentum indicators rely upon a broad set of data points to gauge the velocity of price changes. There is a good reason for this. We often see shifts in momentum prior to actual shifts in a security’s price. By taking into account those momentum shifts, we can make moves before the price does. Some examples of momentum indicators include:
- Stochastic Oscillator
- Relative Strength Indicator
- Average Directional Index
- Rate of Change
- Moving Average Convergence Divergence
Each type of momentum indicator has its advantages. Some compare the relationship between the two moving averages. Others gauge the speed at which price changes over time. The stochastic oscillator pits current price against historic low and high trading prices. Let’s dig a little deeper into what that means.
How the Stochastic Oscillator Works
The stochastic oscillator compares the current closing price to the high and low trading prices over a specified time period. That period could be made up of hours, days, or weeks. It is most often 14 days but can be variable depending upon the trader. That comparison lets us know if there is any shift in momentum beginning to show itself. By determining changes in momentum before security prices make moves, we can make our own moves at opportune times. Making those moves can be very beneficial to our bottom lines.
It may sound complicated, but there is a simple equation that will help it all make sense.
The Stochastic Oscillator Formula
Since the stochastic oscillator is formulaic, we can determine the value of the stochastic indicator by using a simple equation. The stochastic oscillator equation is as follows:
%K = 100[(C - L14) / (H14 – L14)]
- %K - Current value of stochastic indicator
- C - Most recent closing price
- L14 - Lowest trading price over a specified period of time
- H14 - Highest trading price over a specified period of time
Let’s look at that equation in plain language. First, we subtract the lowest closing price from the current price. Next, we subtract the lowest closing price from the highest closing price. Once we’ve got a simple fraction, we divide the first number by the second number. Multiply that number by 100, and you have the current value of the stochastic indicator. Let’s look at a hypothetical example.
Let’s say the high trading price was $50 over the past two weeks, and the low price was $30. Now let’s assume the current closing price is $40. We now have all the info we need. The equation looks like this with our new values substituted for the variables:
%K = 100[(40-30)/(50-30)]
When we work through the equation, we find that the top number becomes 10 and the bottom number is 20. The fraction simplifies to ½ or 0.5. That means that the value of the stochastic indicator is 100 x 0.5, or 50.
Knowing the value is one thing, but understanding how to read and use it is another.
Reading the Stochastic Oscillator
Now that you know how the value is calculated, it’s time to look at how to read it. In the previous example, we landed on a value of 50. That number doesn’t really mean anything, though, until we compare it to other data points. When we string values together, we can start to see patterns.
We mentioned earlier that this is a momentum indicator. We use it to predict trend reversals. That’s because the stochastic oscillator gives us an idea of whether a security might be overbought or oversold. When we see numbers over 80 or below 20 for long periods of time, a reversal may be on the horizon.
Values above 80 indicate that the security is being overbought. If it hovers above 80 for an extended period and drops below 50, it may be time to sell. That’s because it’s possible that the security has been overbought for too long, and is primed for a reversal.
The inverse is also true. Values below 20 indicate that the security is being oversold. If the price hovers below 20 for a period, then starts making upward moves, it may be time to buy. The security has been oversold for too long, and it appears to be gaining upward momentum.
Beyond understanding these simple guidelines, you’ll need to take into account the type of oscillator you’re looking at. There are two of them.
Different Kinds of Stochastic Oscillators
Some people like to live on the edge, while others like to play things a little more safely. Since there are different ways of interpreting and using indicators, there are often variations. As mentioned above, there are two different kinds of stochastic oscillators. There is a fast stochastic oscillator, and a slow stochastic oscillator. Here’s how they differ.
Fast Stochastic Oscillators
The fast stochastic uses the equation we looked at earlier as is. It’s the classic stochastic, and it’s great for aggressive traders. The fast stochastic uses a 3-day moving average (%D) to create a signal line. When the value of the oscillator crosses that signal line, many investors treat it as a trigger to act. It’s a more sensitive indicator and therefore more prone to false signals. The slow stochastic was invented in response.
Slow Stochastic Oscillators
This one is a favorite of day traders. It allows them to make trades without the risk of basing their decision on a false signal. Since the value of the fast stochastic can be volatile, the slow stochastic replaces it with the 3-day moving average. By making the 3-day moving average the value we operate from, we reduce the chances of a false signal.
What is Stochastic Oscillator’s Role in Informing Trades?
Once we’ve had the stochastics indicator explained to us, we have to know when to move on the information. There are a number of ways we can use the stochastic stock indicator to inform trades. Let’s look at a couple of them.
Crossovers
One popular trigger occurs when the stochastic value and moving average lines cross in the overbought or oversold regions. If a downward %K line crosses below the %D line in the overbought region, it may trigger a sell signal. If an ascending %K line crosses above the %D line in the oversold region, we see a buy signal.
Divergences
If the security price hits a lower low while the oscillator shows a higher low, we may see a bullish reversal. This is due to potentially less downward momentum. If the price hits a higher high and the oscillator shows a lower high, a bearish reversal may be coming. These changes in momentum are important things to pay attention to.
Work with Pros and Learn from Them
If you’re going to use this tool to inform your trades, make sure to remember that signals aren’t 100%. Securities can remain overbought or oversold for extended periods of time. Not all momentum shifts indicate true reversals. If you want more insight, it helps to work with people who understand signals well.
Chart Prime tracks the markets for you and alerts you when indicators signal good times to buy or sell. We also have the tools to teach you how to invest wisely and use the technology to your advantage. Whether you’re studying how the stochastic oscillator informs trades or are just dipping your toes in the markets, you’re covered.
If you want to take your new knowledge for a test run, we can help there too. Contact our team to learn how you can use paper trading to get some practice in. Once you understand the ins and outs, you can make more informed trades every day.