

To say that history repeats itself is certainly cliché, but when it comes to market trends, it is an apt cliché. In a way, when analyzing market trends, it’s what you’re hoping for. Technical indicators that can point to when to enter the market for a profitable trade are often based on repeatable trends. One of these favorable indicators is the golden cross pattern. Its predictive power is based on what has happened before. Learning how to spot it adds another tool to your market strategy toolbox.
Let’s dig into how to use this golden crossover strategy by examining these questions:
- What is the golden cross in trading?
- What does the golden cross pattern tell you?
- What is the difference between the golden cross and the death cross?
- What are the limitations of using the golden cross pattern?
- What are some golden cross crypto trading risks?
- What is a Golden Cross in Trading?
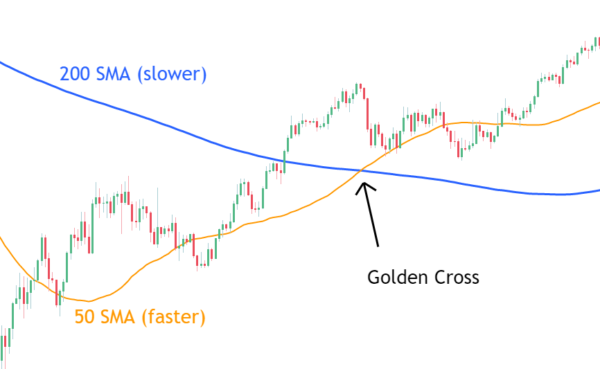
If the golden cross pattern can indicate a favorable market trend, then it’s favorable to learn about it. So, what’s a golden cross? A golden cross is a trading strategy based on a chart pattern used in technical analysis. It’s a fundamental predictive theory that uses past market data to forecast the future of an asset or the market as a whole. The golden cross pattern appears when a security’s short-term moving average on a trading chart rises above the long-term moving average, pointing to an uptrend ahead in the market. This is something you want to spot to jump in the game and stay ahead of it.
Recognizing this event on a trading chart can indicate the potential for a rally. This can be useful for a long-term investor or a day trader. In a bear market, this crossover pattern signals a bullish market on the horizon. A golden cross pattern is usually reinforced by high trading volumes.
The Golden Crossover Moving Average
The moving average is the calculated average of closing prices of an asset or assets charted over a specific time period creating a trend line on a trading chart. The time frame can be set and adjusted at any increment, but commonly used time increments for moving averages are 50 and 200. Day traders use smaller time intervals, such as 5 or 15. Longer time periods though tend to indicate stronger, longer lasting golden cross breakouts. In other words, days are more reliable than minutes. The trend has more time to establish a pattern, making the indicator stronger.
Golden Cross Pattern Example
An example of a golden cross is when an asset’s 50-day moving average pushes above the 200-day moving average. It shows that the trading has been better in the last 50 days than in the last 200. It can signal a market recovery and a bull run on its way. As a trading strategy, this crossover inflection point waves a flag that the road ahead is paved with potential gold. The golden cross pattern can identify a trading opportunity.
The three stages of the golden cross pattern are:
- The golden cross first requires a downtrend where selling is depleted and eventually bottoms out.
- A trend reversal is shown when the shorter moving average forms a crossover pattern through the larger moving average. This golden cross pattern triggers a breakout.
- The final stage of the golden cross pattern is a continued uptrend that leads to higher trading volumes and a bull market.
What Does a Golden Cross Tell You?
The golden cross pattern is a trade indicator that points to positive momentum in the market. It can signal that a bullish market is on its way and can help:
- Spot ideal times to enter or exit the market
- Suggests a definitive uptrend shift in the market
- Signal if a stock is overbought or oversold
- Support other momentum indicators, such as moving average convergence divergence (MACD) or relative strength index (RSI)
- Point to a sustained rise in prices
As a positive indicator of an up market on its way, the golden cross is significant and useful, but it is wise to understand that it has limitations too.
Golden Cross vs Death Cross
The death cross is the exact opposite of the golden cross. The golden cross is moving upward and the death cross is moving downward. In a death cross, the shorter moving average crosses down through the larger moving average. This downward trend indicates that a decisive downturn in the market is on the horizon.
The golden cross pattern signals a long-term bull market moving forward, while the death cross pattern signals a long-term bear market moving forward. Both are useful indicators that support market predictions by pointing to a trend change. They are both, however, more significant when accompanied by a high trading volume.
Another way to look at it is that the golden cross can signal a trend that moves out of a bear market and into a bull market. The death cross on the other hand can signal a trend that moves out of a bull market and into a bear market. They both are crossover patterns, meaning they cross from bearish to bullish or from bullish to bearish. The death cross can mean moving to protect your investments while the golden cross can mean making a move for larger profit.
The Limitations of a Golden Cross
Market indicators show a trend, but it is a trend that has already happened. The indicators are not foretelling the future, and they are telling you what happened in the past. There is always a lag. The prediction is predicated on what the pattern has meant before. This is hoping history repeats itself, but that repeat is not guaranteed. Nothing in trading ever is.
In the last ten years, a golden cross pattern has signaled a bull run six times. But false signals happen all the time. It can seem reliable, but when using the golden cross strategy, it is best to back it up with other indicators before jumping in. Combining the golden cross pattern trading strategy with other signals can help confirm that you are not getting a false signal. The key to the golden cross strategy is to balance it with proper risk parameters. Keeping the risk-to-reward ratio favorable yields better results than following the golden cross with your eyes closed.
Although learning to read chart patterns is important for more confident trading, as said before, nothing is guaranteed. Risk always exists. A leading indicator can foresee a predictable pattern, but it cannot predict the future.
What is a Golden Cross in Crypto?
The golden cross is a widely used bullish indicator used in cryptocurrency trading, but it has its limitations in the crypto market as much as in more traditional trading. Short-term trading is risky, even if the potential for profit is high. The risk and profit are weighted like a seesaw. High risk on one side and high profit on the other. They exist together, and in a more volatile market the more likely the seesaw flies to one side or the other. In the volatile crypto market, this risk can be amplified.
The cryptocurrency market works on a global platform through online crypto exchanges. It offers opportunities to traders and investors to participate worldwide. In the long history of market trading this type of exchange is new. As such, it can be inherently volatile.
The golden cross pattern is a traditional market strategy using traditional analysis and indicators, but it is often applied to the crypto market. The limitations of the golden cross, as outlined above, exist in crypto trading as well. Knowing your market helps in using the golden cross. Crypto markets are no different. Doing your homework is a vital part of any trading strategy and that goes for crypto too. Back up your decisions with multiple data points and indicators, not only the golden cross.
Another Trading Strategy in your Toolbox
The golden cross is a positive technical indicator of what’s to come based on what has already occurred. Its foundation is built on what it has signaled in market history. It can also be foundational to building a more profitable trading strategy. As it can signal a significant and sustained uptrend, adding it to your trade strategy toolbox is important. Learning both what it can tell you and also its limitations is what a smart trading strategy is all about. In the end, it’s preferable to spot a golden cross pattern than its opposite.