

Every trader dreams of making big profits and achieving financial freedom. But accomplishing this is easier said than done. Even the Warren Buffets of the trading world are essentially gambling with their money and exposing themselves to risk every time they step into the market.
This is why every trader– whether a seasoned expert or a novice– needs a solid trading strategy to help them manage risk, stay disciplined, and boost their chances of success. So, in this article, we’re going to explore a versatile strategy that every trader should have in their arsenal.
Enter the Ichimoku Cloud strategy.
The Ichimoku Cloud
Hailing from Japan, the word “ichimoku” means “one look.” Thus, the Ichimoku Cloud refers to the fact that you can gauge support and resistance levels in just one glance. It was created by a Japanese journalist, Goichi Hosoda, who spent nearly thirty years perfecting it before releasing it to the public in the late 1960s.
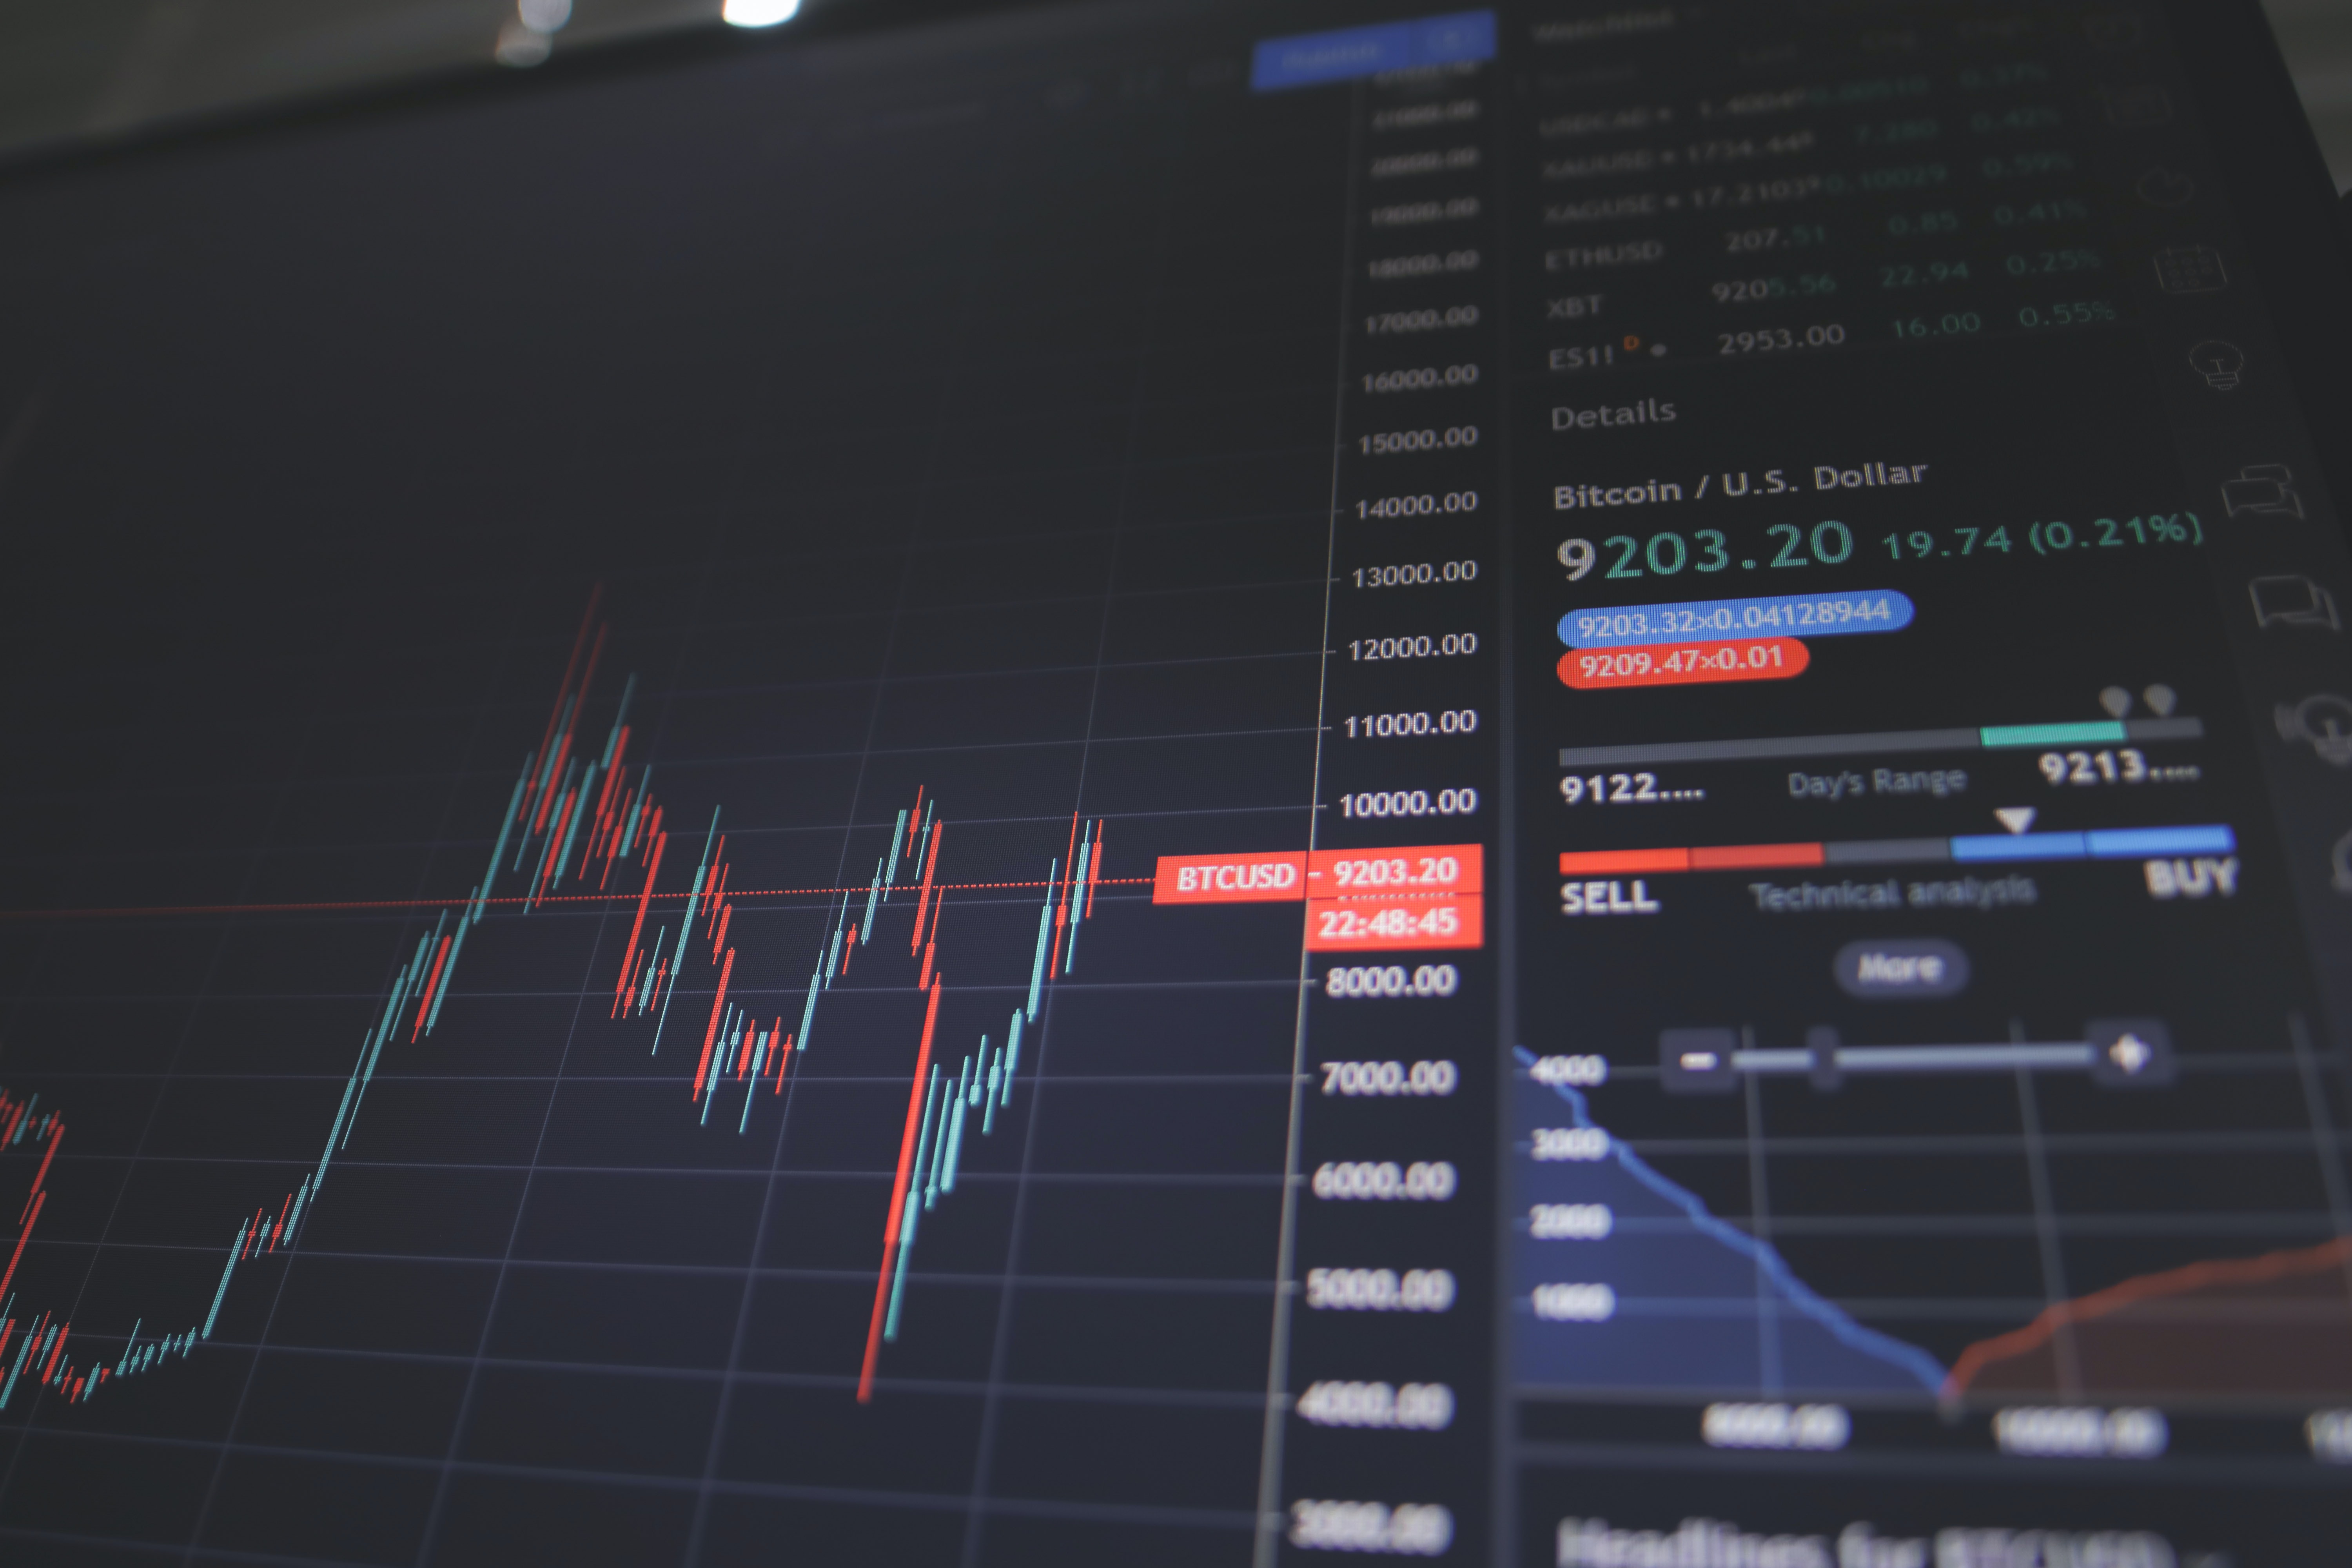
The Ichimoku Cloud (also known as ‘Kumo’) is a collection of technical indicators that's used by traders to identify potential market trends and momentum. It’s a popular technical analysis tool that can be used across different markets and timeframes.
How does the Ichimoku Cloud chart work?
The Ichimoku Cloud strategy takes multiple averages and creates a “cloud” shape by plotting the averages on a Cloud chart. This “cloud” predicts where a price might run into support or resistance in the future. And, since more data points are used with this “cloud mapping” than with Japanese candlesticks, the Ichimoku Cloud arguably shows a clearer picture than a standard candlestick chart.
Why traders use Ichimoku analysis
While many other technical indicators only show support and resistance levels for the current timeframe, the Ichimoku Cloud shows support/resistance levels that can be forecasted into the future and across a variety of markets. This said, traders often leverage the Ichimoku Cloud to stay ahead of the game in the fast-paced world of trading.
What’s the Ichimoku Cloud strategy?
Turning the Ichimoku Cloud into a profitable strategy is all about using a moving average trend technique to determine the next projected move of a stock. Since this strategy can locate potential trend movement and momentum, it can provide notifications to traders for possible buy and sell signals.
Breaking down the Ichimoku Cloud strategy
There are five Ichimoku Cloud indicators that make up the “cloud.” These indicators are moving averages that might also be referred to as components of the Cloud or plot points. Whatever you call them, they each represent a specific aspect of the price action.
So, let’s go over what each one means and how they’re each calculated to help traders identify buy/sell opportunities in the market.
Tenkan Sen
The Tenkan Sen is what the Ichimoku conversion line is, and it’s usually represented by a red line. It measures the average of a given price’s highest high and lowest low over the last nine periods. Thus, the market is said to be trending if the Tenkan Sen red line is moving upward or downward. Conversely, the market is deemed to be ranging if the red line is moving from side to side.
How to find the Tenkan Sen
Since the Tenkan Sen is determined by taking the average of the highest high and the lowest low over the previous nine periods, the equation for calculating it looks like this:
Tenkan Sen = (9th Period Highest High + 9th Period Lowest Low) / 2
Kijun Sen
Also called the Ichimoku baseline, the Kijun Sen is typically represented by a blue line. As a support/resistance line, it acts as an indicator of future price movements. It measures the average of a given price’s highest high and lowest low over the last twenty-six periods. In regards to the Ichimoku Cloud strategy, most traders consider it more accurate than the Tenkan Sen since it measures averages over a longer period.
How to find the Kijun Sen
The equation for calculating the Kijun Sen is the same as the Tenkan Sen formula, except it uses twenty-six periods instead of nine periods. So, it looks like this:
Kijun Sen = (26th Period Highest High + 26th Period Lowest Low) / 2
Senkou Span A
To develop an Ichimoku Cloud strategy, traders have to understand how to read the Senkou Span A line. This orange line on the Ichimoku chart is one of the two lines that make up the "Kumo" or cloud. It’s calculated as the average of the Tenkan Sen and Kijun Sen lines and plotted 26 periods ahead.
How to find Senkou Span A
The equation for calculating the Senkou Span A looks like this:
Senkou Span A = (Tenkan Sen + Kijun Sen) / 2
Senkou Span B
Senkou Span B is the partner line of Senkou Span A that makes up the "Kumo" or cloud. It’s a blue line that’s calculated by taking the highest high and lowest low of the past 52 periods and dividing by two. Then, that quotient is plotted 26 periods ahead.
How to find Senkou Span B
The equation for calculating the Senkou Span B looks like this:
Senkou Span B = (52nd Period High + 52nd Period Low) / 2
Chikou Span
When using the Ichimoku Cloud strategy, traders use the Chikou Span to read the market sentiment. This indicator is represented by a green line on the Ichimoku chart and it shows what the prevailing trend is as it corresponds to current price movement.
How to find the Chikou Span
The Chikou Span line plots the current closing price shifted 26 periods to the left on the chart, allowing traders to compare current price levels with previous price action to identify potential support and resistance levels, trend changes, and other market signals. So, the equation for calculating it looks like this:
Chikou Span = Current closing price plotted 26 periods behind
Practicing the Ichimoku Cloud strategy
While it does take practice to learn how to interpret the Ichimoku Cloud, you don’t have to be a mathematician or investing whiz to figure it out. So, if calculus and economics weren’t your strongest subjects in school– don’t sweat it. With a little patience, Ichimoku signals and Ichimoku patterns are pretty easy to interpret and apply to your strategy.
How to read the Ichimoku Cloud
The five plot lines that we went over in this article make up the Ichimoku Cloud (‘Kumo’). And once you start recognizing each plot line on the Ichimoku chart, you’ll be able to understand what they mean and how they can uncover trading opportunities.
We’ve shared a few bullet points below to help you interpret the Kumo so you can effectively use the Ichimoku Cloud strategy.
- When Senkou Span A (the orange line) is rising above Senkou Span B (the blue line), it means that the current uptrend is getting stronger. Conversely, when Senkou Span A is falling and below Senkou Span B, it means that the current downtrend is getting stronger.
- When the Tenkan Sen (the red line) crosses above the Kijun Sen (the blue line), it reinforces a buy signal. On the other hand, when the Tenkan Sen crosses below the Kijun Sen, it reinforces a sell signal.
- A bullish Kumo occurs when the Senkou Span A line is shown to increase above the Senkou Span B line. This predicts a bullish trend.
- A bearish Kumo occurs when the Senkou Span A line falls below the Senkou Span B line. This predicts a bearish trend.
Ichimoku Cloud strategy: The bottom line
This trading strategy is versatile, visual, and easy to interpret– making it an attractive choice among traders across a diverse range of markets and multiple timeframes. Thus, it’s a valuable tool in any trader's arsenal and is worth considering as part of a comprehensive trading strategy.
With some practice and patience, you may find that the Ichimoku Cloud can help you unlock new trading opportunities and improve your chances of success.